
OpenTelemetry Collector on Docker Swarm
Two clusters, running for months, and no logs anywhere except docker service
logs and my own patience. I decided to fix that.
I thought it is a configuration task. Write some YAML, point it at a backend, go and do something else. It seems it was not.
Every version of that YAML passed otelcol validate. Every one. Including the
version that lost data, the one that shipped every line twice, the one that
filled a disk with its own output, and the one whose regex could never match
anything at all.
Context
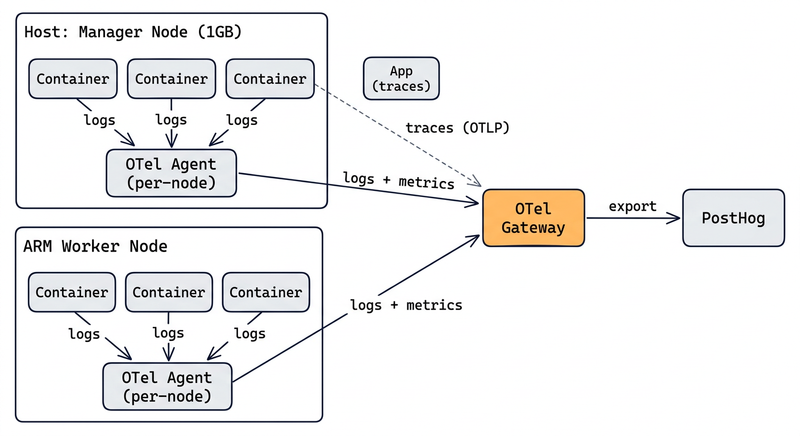
Camelot AI runs on two small Docker Swarm clusters. Test and production, two nodes each: a 1 GB manager that is always a bit close to the edge, and a big ARM worker. The goal was ordinary — container logs, node and container metrics, and an OTLP endpoint for traces I haven’t written yet. Everything to PostHog, which I already use.
Architecture
I ended with two components:
- an agent on every node, as a Swarm global service, reading container logs off that node’s own disk;
- a gateway, one replica, holding the credentials and talking out.
The agent-per-node is not a design preference. Container logs live in
/var/lib/docker/containers on the machine that ran the container. One central
collector can’t see other nodes’ logs, no matter how you configure it.
It ingested its own logs
The first run on a real node produced 1.8 million lines of debug output in about seventy seconds. On a node with 31 GB free it is not a comfortable rate.
Almost all of it came from one container — the collector itself. It discovers containers over the Docker socket and tails each one’s log file. It discovered itself. So it read its own output, and printing anything about a log record produced another record, which it then read. A small loop, running at whatever speed the disk allowed.
The fix is two lines of excluded_images. I would never have written them from
the documentation — you need to see the loop first.
extensions:
  docker_observer:
    endpoint: unix:///var/run/docker.sock
    # most containers here publish no ports, and without this they are
    # never discovered at all
    include_all_containers: true
    # globs, because the deployed tag is a commit sha
    excluded_images:
      - "*otel-agent*"
      - "*otel-gateway*"
      - "*opentelemetry-collector-contrib*"
Later I excluded the gateway too, for the mirror reason: a failing export makes the gateway log, and shipping that log back through the gateway amplifies exactly the failure it reports.
The duplicate
The numbers still looked high. Every line from one container appeared exactly twice.
The observer has an option include_all_containers. I read it as “emit an
endpoint for every container”, which is true, and missed the point: it emits a
port-less endpoint in addition to one per exposed port. A container
publishing two ports is matched three times. Three filelog receivers on one
file. Every line shipped three times, to a backend that bills by volume.
The fix is port == 0 in the discovery rule. Obvious once you see the
duplicates, invisible before.
receivers:
  receiver_creator/containers:
    watch_observers: [docker_observer]
    receivers:
      filelog:
        # port == 0 is the single port-less endpoint - matches once,
        # not once per exposed port
        rule: type == "container" && port == 0
        config:
          include:
            - /var/lib/docker/containers/`container_id`/`container_id`-json.log
          start_at: beginning
Making it safer lost data
This one I like the most, because I did it to myself on purpose.
A review comment suggested lowering the memory limiter from 160 MiB to 128, to leave more headroom on the 1 GB manager. It sounds sensible — the node really is OOM-prone. I agreed and changed it.
Then I ran it, and the log said data refused due to high memory usage.
With the tighter limit, the limiter refused batches while the agent worked through the backlog of existing logs — and the filelog receivers, when refused, dropped those records instead of waiting. I made the collector safer against OOM by making it lose logs. The whole point of the collector is to not lose logs.
The real fix was not a number. It was retry_on_failure on the receivers, so
back-pressure replaces dropping: when the limiter bites, the receiver stops and
waits.
processors:
  memory_limiter:
    check_interval: 5s
    limit_mib: 160
    spike_limit_mib: 40

receivers:
  receiver_creator/containers:
    receivers:
      filelog:
        config:
          # without this the receiver drops records outright whenever
          # the limiter refuses a batch, instead of waiting for it
          retry_on_failure:
            enabled: true
            initial_interval: 1s
            max_interval: 30s
Then 160 MiB was fine. A real node settles around 137 MiB.
I would have merged the 128 and felt responsible about it.
A fix that was not a fix
In PostHog every metric arrived with service set to unknown. That part was
easy — metrics carried no service.name at all, and unknown is what a backend
shows when it’s missing. Logs had one, metrics never did.
So I wrote a transform to fill it from the Swarm service label, ran it, and
unknown was gone. Fixed.
Except the names read srv-captain--db.1.mms89736vzjrjpsfn6yagtb0w. The Swarm
label branch never matched. docker_stats promotes those labels to resource
attributes, not data point attributes, despite the option being called
container_labels_to_metric_labels, and I read them in the wrong context, where
they are always nil. Everything fell through to the fallback.
receivers:
  docker_stats:
    # this is where docker.service.name comes from
    container_labels_to_metric_labels:
      com.docker.swarm.service.name: docker.service.name

processors:
  # wrong - datapoint context, where the label is always nil
  transform/service_name_wrong:
    metric_statements:
      - context: datapoint
        statements:
          - set(resource.attributes["service.name"], attributes["docker.service.name"])

  # right - despite the option's name, docker_stats puts it on the resource
  transform/service_name:
    metric_statements:
      - context: resource
        statements:
          - set(resource.attributes["service.name"], resource.attributes["docker.service.name"])
If I only checked that unknown disappeared, I would have shipped that.
The obvious alternative would have failed too, for another reason. Trimming the
task suffix off the container name works for replicated services, named
service.slot.task, and quietly breaks for global ones, named
service.node-id.task — which is exactly what my own agent is.
The escape hatch
The agent has to run on every node, which in Swarm means a global service.
CapRover, which manages my clusters, has a Service Update Override field for
exactly this. So I put the mode in it, and it refused to save: must specify
only one service mode.
Its merge is additive. It merges Global next to the generated Replicated
instead of replacing it, and Docker rejects a spec carrying both. There is an
open issue from 2024 with a
suggested workaround using a pre-deploy script.
The workaround can’t work, and it took reading CapRover’s source on the manager
to see why. It creates every app’s service from a placeholder image first, so
the service always exists as replicated before any deploy, and the daemon
refuses mode changes on an existing service: service mode change is not
allowed. No update-time manipulation converts it.
A service has to be created global. So: let CapRover deploy normally, then recreate the service from the spec CapRover itself generated, with only the mode swapped.
#!/usr/bin/env bash
set -euo pipefail

SERVICE="${1:-otel-agent}"

# idempotent: a global service is already what we want
docker service inspect "$SERVICE" --format '' \
  | grep -q Global && exit 0

# reuse the spec CapRover generated, and change only the mode. rebuilding
# it by hand would drop the labels, env, limits and placement it set.
docker service inspect "$SERVICE" --format '' > /tmp/spec.json
python3 -c '
import json
spec = json.load(open("/tmp/spec.json"))
spec["Mode"] = {"Global": {}}
json.dump(spec, open("/tmp/global.json", "w"))
'

docker service rm "$SERVICE"
curl -s --unix-socket /var/run/docker.sock -X POST \
  -H "Content-Type: application/json" \
  -d @/tmp/global.json \
  http://localhost/v1.44/services/create
After that CapRover manages it happily, because merging Global into
an already-global spec is a no-op.
A short bash script, and both clusters survived several redeploys since. I put the findings on the upstream issue — it felt honest after taking the maintainer’s time indirectly.
Everything was info
By this point the pipeline was healthy by every measure I had. Zero export
errors, memory where I expected it, both clusters green. Then I looked at the
data, and every record said info.
Not most of them. Every one. A Postgrex disconnect and a failed schema migration sat in PostHog at the same level as a 200 response:
body: "07:11:40.138 [error] Postgrex.Protocol ... disconnected: ... timed out"
severity_text: info    severity_number: 9
The container operator unwraps Docker’s JSON envelope — log, stream,
time — and stops there. The application’s own line stays raw text, so nothing
sets severity, and PostHog shows unset severity as info. The collector was
working perfectly and the result was useless.
So I wrote a regex to pull the level out of the Elixir format. It matched nothing. I had written it as a folded YAML scalar:
# matches nothing, and validates fine
regex: >-
  ^\d{2}:\d{2}:\d{2}\.\d{3}
  (?:request_id=(?P<request_id>\S+) )?
  \[(?P<level>[a-z]+)\]

# works - one line, single-quoted so the backslashes survive
regex: '^\d{2}:\d{2}:\d{2}\.\d{3} (?:request_id=(?P<request_id>\S+) )?\[(?P<level>[a-z]+)\]'
>- joins its lines with spaces. That puts an extra space before the bracket,
so the pattern can’t match a real line. otelcol validate accepted it, because
it is a perfectly valid regex. It just fires never.
Then the regex worked, and it still wasn’t right. Docker gives the collector one
record per physical line, so a text-formatted stack trace arrives as several
records and only the first carries [error]. The rest strand at the default
level:
"09:58:10.874 [error] Could not create schema migrations table..."  -> error
"  * The database does not exist"                                   -> info
No pattern fixes that — the lines are separate records before the collector ever sees them. So released builds log JSON now. JSON escapes the newlines, so one event stays one line and one record, and every metadata key arrives as a field instead of being recovered by guesswork.
# config/runtime.exs, :prod only - mix phx.server stays readable
config :logger, :default_handler,
  formatter: LoggerJSON.Formatters.Basic.new(metadata: [:request_id, :mfa, :crash_reason])
One last trap on the way out. Severity parsers keep the word the application
used, and Elixir says warning. PostHog filters severity by exact match against
six lowercase buckets, so warning never matches warn. The level looked
parsed and stayed unfilterable.
What I learned
otelcol validate accepted every broken version of this config. It was right
to — the schema was valid every time.
Validation proves shape. It doesn’t know that a discovery rule matches three times, that a receiver can see its own output, that a memory limit interacts with a backlog, or that a label lives in a different context than you assumed. Those are behaviours, and behaviour only exists on a real node with real containers. Most of the problems here would have passed any review I could write, because the YAML looks correct. It is correct, in the sense a linter means. The folded scalar is the purest case: a valid regex, a valid config, a green check, and a pattern that can never match a single line.
There is one nice detail in all this. Containers here arise and cease all the time — a task container lives forty minutes, a probe container lives one second — and the only thing that persists across them is a small file of read offsets on the host. Impermanence (མི་རྟག་པ།) is not a metaphor in a Swarm cluster. It is the scheduling model, and if you want to remember anything you have to write it down somewhere the scheduler can’t reach.
Both clusters now ship logs and metrics, with zero export errors and about 137 MiB on the node I was worried about. Traces are ingesting and empty, because I haven’t instrumented the app yet. That’s the next piece.
Neither cluster has Docker log rotation configured, which I found when the
parser choked on six truncated records left by a disk-full event two weeks
earlier. It is still not configured. It needs a dockerd restart per node, and
I haven’t decided when.
If there is one thing worth taking from this, it is the memory limiter. A sensible suggestion, applied carefully, made the system lose the exact data it exists to collect — and the only reason I know is that I ran it and read the output, instead of trusting that a smaller number is a safer number.
The process is going on…